Originally posted on Substack
Art is the imposing of a pattern on experience, and our aesthetic enjoyment is recognition of the pattern." - Alfred North Whitehead
R and Generative Art
How do you like to see tools used for different things?
I enjoy seeing a tool used for something entirely different.
Take Excel, for example, it is a complicated calculator with a bunch of functions used for managing portfolios, budgeting, forecasting, to personal databases as the normal use case of Excel. Then you can get into those who have used it to create interfaces to databases, music beat sequencers and the game of doom.
And art is not excluded from the fold of “everything.”
{{ youtube OrwBc6PwAcY }}
Or can also be used for things like the above video or this.
“The second best tool for everything” as my boss recently had mentioned.
And he is right, it isn’t the best tool, the most scalable tool, or the best painting tool.
To me, it’s fascinating to see tools that were created for one thing and then used for something entirely different. It emphasizes the beauty of the adaptability of our surroundings by using tools for entirely new things. It also illustrates the palette of mediums that can be used to create.
Everything under the sun has been used to create something new and different.
So then why R?
I regularly use R for my job to do data munging, visualization, and data science tasks. Most of the time these are cleaning data for analysis, drawing quick graphs to check the distribution of data, and building simulation models and forecasts for Supply Chain at work.
What is R?
R is a language and environment for statistical computing and graphics. It is a GNU project which is similar to the S language and environment which was developed at Bell Laboratories (formerly AT&T, now Lucent Technologies) by John Chambers and colleagues. R can be considered as a different implementation of S. There are some important differences, but much code written for S runs unaltered under R.[1]
Note: A great resource on everything R is aggregated at R-Bloggers. or the company R-Studio who has developed an eclectic niche of software engineers who have been vital to the proselytization of R in the past decade.
To me, it is a glue used to take disparate sources and bring them together to create knowledge with a mature environment of packages written by many across the landscape of academia and business.

This “glue” also creates fantastic visual products. There are beautiful data visualizations created with the packages such as ggplot2 or Plotly. And there are many tutorials and content that describes data in a visual fashion. Eventually, I’ll write a piece on the thoughts I have explored the question, Is data visualization a subset of generative art? Or is it less likely to fall under a different category altogether? More on that later.
Outside of data visualization, there are more abstract pieces that are created. I’d say data is still important, but the information is more hidden or being described in a dimension that isn’t easily understood.

My first encounter was finding the website by Antonio Chinchon of Fronkonstin. Who I have found has created some wonderful blog posts describing in detail the process of the work that he has created using R.

And there are many more, Thomas Pedersen, Danielle Navarro, Paul Vanderlaken, or Antonio Chinchon, and others who have worked on creating art in the R space.
So even though this tool has always been more about data processing then creating; I think there are a few interesting arguments that using R might be another great tool for generative art:
- It is a mature environment with a large contributors of active development
- When playing with the concept of distributions, randomization, etc there is alot of content and ideas to yet be explored
- Many data packages that can be transformed into more abstract or hidden variations of data
- Visualization packages come in functional and aesthetic packages
- Being a glue language, it also can be easily interfaced with other languages (i.e. C++, Python, Javascript, etc) This inherently can then provide the outputs of generative content
If you have more, let me know as I am curious of what your thoughts are around this idea. I am not trying to convince it is the tool to use, however as an explorer and tinkerer I appreciate the fact of using tools for more than they were originally intended and to celebrate the creativity of the human spirit.
To end, here is a talk by Thomas Pedersen who has been deeply embedded in the R community and his thoughts on generative art and R.
{{ youtube 8FWSrvEFY4E }}
Have a wonderful week!
Chris Ried
P.S. Check out the following package if you have R installed…. it’s a fun generator.

The R package to Create Generative Art
The R package generativeart lets you create images based on many thousand points. The position of every single point is calculated by a formula, which has random parameters. Because of the random numbers, every image looks different.
Wrapup - Genuary 2021
This has been wonderful to have participated in this year’s daily challenges. It has been full of beautiful work done by many artists across the world. Some of you did every single challenge, others only a couple.


Source: _matthiasjaeger / amy_goodchild / bb_bygones / feamonkey / graham.odds / loackme / rvig.art / tasty_plot
P.S. I do promise that I’ll have posted the interview with Tyler Hobbs this week either as a separate post or nexts weeks edition.
Inspirations
📸 Generative Graphics

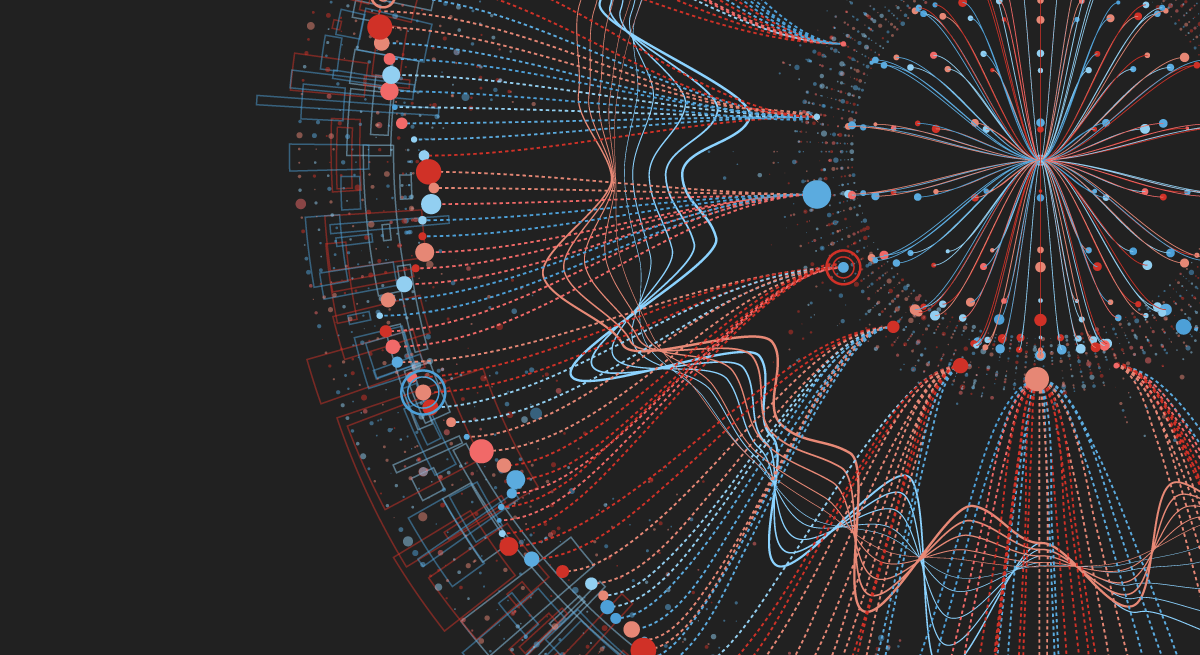
Visualizing Jacob Collier’s “Moon River”
Several dimensions of the data are encoded into the visual.
Each of the 157 notes is encoded by a wave
Each wave is placed vertically according to when the note is sung (from top to bottom)
The distance between ripples within the wave maps to the wavelength of the pitch being sung (not quite proportionally (that was ugly), but just enough to be noticeable)
The color of each wave maps to its pitch class with notes of the core F-major triad in a subtle, dark blue, and more dissonant pitches (Bb and Eb in this case) in a brighter spicier blue.
The spacing between waves (and thus, the amount of each wave that remains visible) is proportional to the duration of each note. Longer-duration notes have larger portions of the wave visible.
A submission for Genuary, which I find to be a very thoughtful piece as he Matt uses multiple elements of the song “Moon River” by Jacob Collier.
🏛️ Exhibits / Installations
Mathematical Art Galleries

The online home of the mathematical art exhibitions from the annual Bridges Conference, Joint Mathematics Meetings (JMM), and ICERM Illustrating Mathematics program; as well as the Bridges Conference Short Film Festival and Bridges Conference Fashion Show.
This site has a wealth of inspirational pieces that were generated and inspired by mathematical techniques that were displayed at the above-mentioned conferences which go back to 2010. Check them out to see the vast beauty of the mathematics.
🔖 Articles and Tutorials
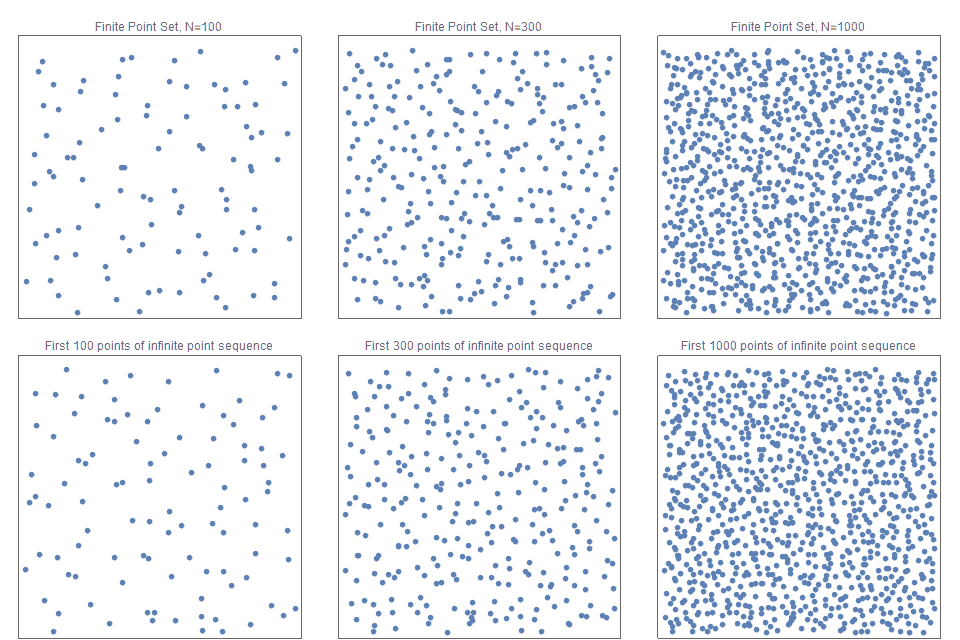
A simple method to construct isotropic quasirandomblue noise point sequences
I describe a simple method for constructing a sequence of points, that is based on a low discrepancy quasirandom sequence but exhibits enhanced isotropic blue noise properties. This results in fast convergence rates with minimal aliasing artifacts.
{{ youtube 8Uo6zFwSO78 }}
Matt DesLauriers, an artist and freelance creative coder, talks about his passion for generative art — searching for inspiration, exploring open tools and workflows, and finding his own path within the field. Learn about conceptual art, pen plotters, light installations, and how print artworks can be created with JavaScript and the web platform. Matt breaks down some of the algorithms and processes involved in his work, providing you with the building blocks to create your own generative art.
Getting Familiar with Unique Visualizations
Visualization can be defined as representing data in a more understandable way using graphs and charts. Any graphical presentation that conveys some useful information or insight can be thought of as Visualization. Visualization has evolved from cave drawings and thematic cartography of 17th century to modern interactive 3-D plots.
I’m of the mindset that data visualization falls under the umbrella of generative art. The brush strokes are informed a little differently than a direct agent, but that of an indirect one. It can be the market, weather, or the buying behavior of consumers. They all still use varying agents to promote aesthetic, psychological, or tangible significance.

Courses
Books

Code as Creative Medium
This book is an essential resource for art educators and practitioners who want to explore code as a creative medium, and serves as a guide for computer scientists transitioning from STEM to STEAM in their syllabi or practice. It provides a collection of classic creative coding prompts and assignments, accompanied by annotated examples of both classic and contemporary projects, and more than 170 illustrations of creative work, and features a set of interviews with leading educators. Picking up where standard programming guides leave off, the authors highlight alternative programming pedagogies suitable for the art- and design-oriented classroom, including teaching approaches, resources, and community support structures.
The book I’d consider to be an “ode” to the medium of code and and its usage in todays artistic endeavors. It’s broken out into 3 sections: exhibits, exercises and interviews. The exhibits are then divided into different fields of inspiration such as iterative patterns and generative landscapes which Golan Levin takes meticulous care in providing current artistic installations in the subject piece. In the exercises, the book is meant to be used as a textbook and has a portion of helpful prompts to be creative and ends in discussions with current artists on teaching art and code.